CFDs are complex instruments and come with a high risk of losing money rapidly due to leverage. 76% of retail investor accounts lose money when trading CFDs with this provider. You should consider whether you understand how CFDs work and whether you can afford to take the high risk of losing your money.

Accumulative Swing Index (ASI)

The Accumulative Swing Index (ASI) is an indicator that shows the cumulative value of the swing index over a period of time. Learn more about it in our educational guide.

What is the Accumulative Swing Index?

The Swing Index (SI) is a popular technical indicator designed with the aim to predict movements in securities prices, mainly to inform futures trading. The Accumulative Swing Index (ASI) shows the cumulative value of the swing index over a certain period of time. 

In this guide we explore the importance of the ASI in technical analysis, as well as its history and how being able to interpret its signs could help traders make better informed decisions.

Highlights

  • The Accumulative Swing Index shows the cumulative value of the swing index over a certain period of time.

  • The index was created by Welles Wilder in 1978.

  • The ASI formula is: SI = 50 × (C – Cy + 0.5 * (C – O) + 0.25 × (Cy – Oy)) / R. Where C is the current close price, Cy is the previous close price, O is the current open price, Oy is previous open price and R is the highest range value.

What does the Accumulative Swing Index do?

The ASI was developed in 1978 by J. Welles Wilder Jr, an American mechanical engineer turned full-time market trader and researcher. He once said: 

“Somewhere amidst the maze of Open, High, Low and Close prices is a phantom line that is the real market.” 

The ASI attempts to show this ‘real market’.

The Accumulative Swing Index is calculated by taking the difference between the current close and the previous close, as well as the range between the current high and low, then combining the two values. 

This score is then accumulated over time to create a trend line. The ASI can be used to identify possible points of reversal and to determine the strength of a trend.

Calculating the Accumulative Swing Index

The Swing Index formula is:

SI = 50 × (C – Cy + 0.5 * (C – O) + 0.25 × (Cy – Oy)) / R

Where:

  • C = current close price

  • Cy = previous close price

  • O = current open price

  • Oy = previous open price

  • R = the highest range value, selected from the following options:

    • (Current high – current close)

    • (Current low – current close)

    • (Current high – previous close)

    • (Current low – previous close)

The Accumulative Swing Index can be calculated by accumulating the swing index values:

ASI = ASI (previous) + SI (current)

As the Accumulative Swing Index indicator is based on the price of a security, it typically follows the candlestick pattern on a price chart. It plots a cumulative total for the Swing Index value of each candle.

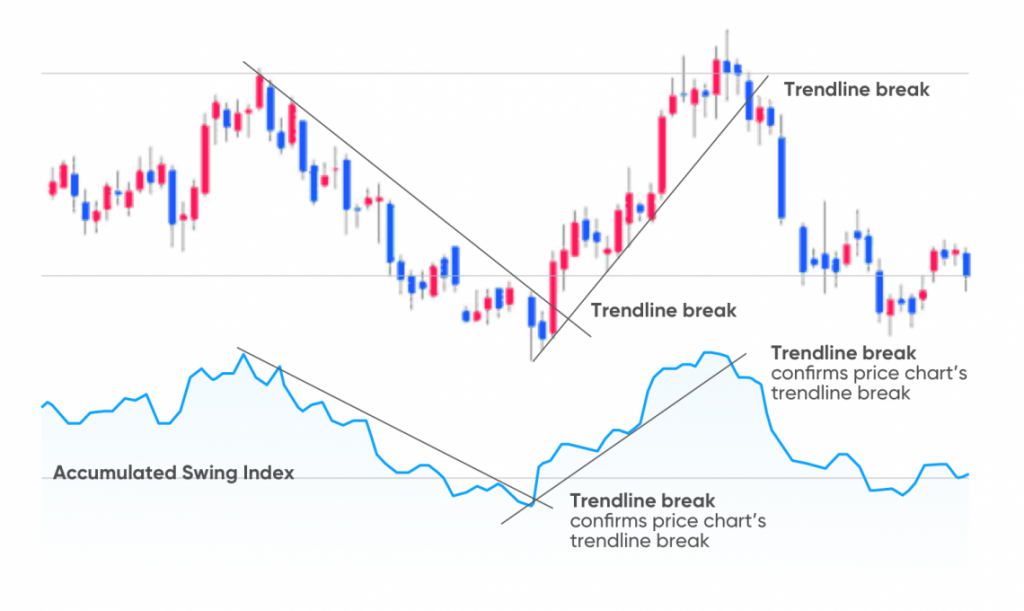
The ASI shows technical support and resistance levels and provides confirmation of trends once the price breaks through either one of those levels. As an index, the trendline usually works in a range between 100 and -100. 

It is typically charted as a standalone trendline, similar to volume bar charts.

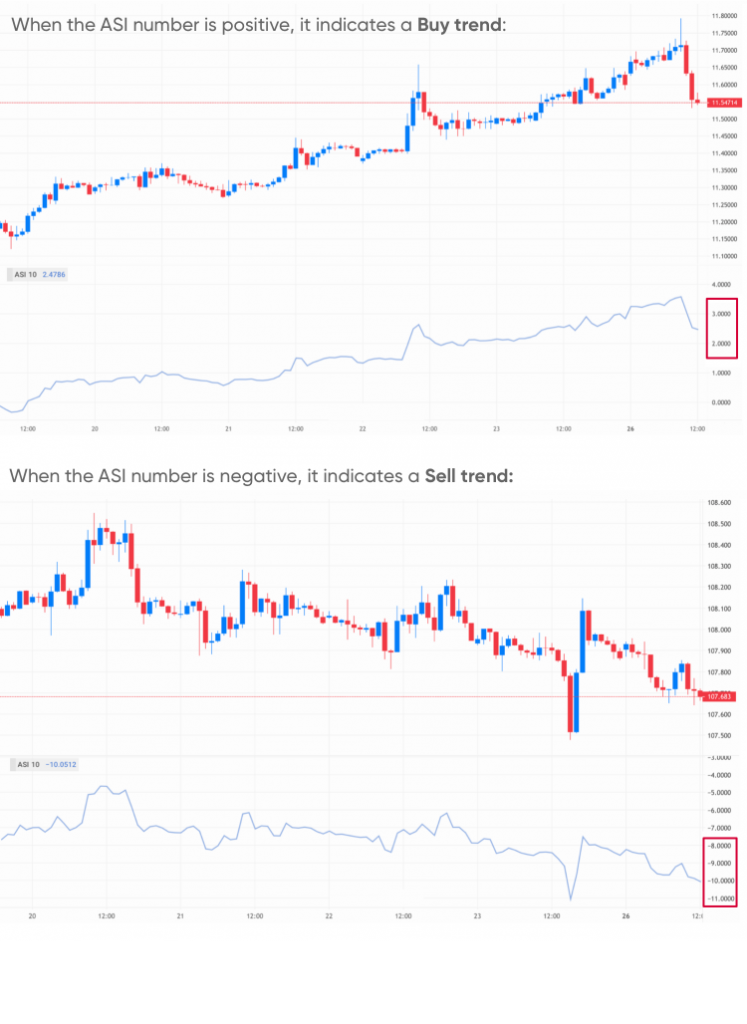
When prices swing higher, the ASI value moves above zero and increases along the scale towards 100. Conversely, when prices swing lower into a downtrend, the value turns negative and moves down towards -100. 

A swing signal is defined as when the price of the security breaches the previous high or low swing. When the ASI number is positive, it indicates the price could likely trend higher over the long term, when it is negative it could indicate that the market may be in a long-term downtrend. 

In a flat market, the technical chart will not show a price swing and the ASI will be close to zero. 

According to this strategy:

If ASI values fluctuate between positive and negative, or remain near zero, it is an indication that the market is currently flat and you may consider using other technical indicators.

How to use the Accumulative Swing Index in trading

The ASI may be useful as a tool to help confirm a price pattern. Traders could potentially use the index as part of their routine trading strategy by taking it as a price signal, opening a long position when the index value moves up or closing a long position and going short when the value moves down.

A choppy ASI chart might provide a clearer price signal than a stable indicator. 

However, those following the ASI for trading purposes should be aware of the limitations of the index. In some cases, the asset price may not reverse direction when the ASI pattern ends. However, traders could wait for the indicator to catch up and turn in the new direction before opening or closing their position.

A real-life example of trading with the Accumulative Swing Index is using it to identify potential entry and exit points for a particular stock. By using the Accumulative Swing Index to measure momentum and direction of a stock, traders can look for areas where the stock is either overbought or oversold and use that as a signal to enter or exit a position.

Advantages and disadvantages of the ASI

Advantages

  • The Accumulative Swing Index is generally a tool used by swing traders, as it provides an indication of market trends.

  • The index does not require any complicated calculations or software.

  • It could potentially be used to identify overbought and oversold conditions in the market.

  • The ASI could be used to identify potential entry and exit points for swing trades.

Disadvantages

  • The Accumulative Swing Index is not designed to predict price movements, but only to identify existing trends.

  • The indicator is only useful in a trending market, making it of limited value in, for example, range-bound or choppy markets.

  • It is considered a lagging indicator, meaning that it does not provide any advance warning of upcoming price changes.

  • The ASI could be best used as part of a broader technical analysis strategy that also takes into account other indicators and data points. 

Using Accumulative Swing Index in trading strategies

An Accumulative Swing Index strategy may be useful for swing trading, as it confirms changes in price direction. 

Swing traders could focus on small price changes into either direction, on the basis that prices constantly shift up and down. They open long or short positions that they hold only for short time periods before taking profits. In that way, traders can make profits from intraday gains even if a security price is below the previous close, and profit from prices that fall intraday despite trading above the previous close.

Traders use ASI as a tool to identify breakouts from trends and confirm price divergence, helping them to make decisions on when to open and close trades. 

Although the indicator was created for futures prices, it can also be used to analyse long-term stock and currency price moves.

Conclusion

The Accumulative Swing Index is a technical analysis indicator that measures the strength of a trend in a stock or commodity. It is based on a range of indicators, including the swing points, momentum, and volume. The ASI is used to identify potential buy or sell entries as well as to confirm the strength of an existing trend.

Knowing how to recognise trading patterns could potentially help traders make more informed decisions in their trading. However, it’s important to remember that there is always the risk of making a loss. Traders should conduct their own thorough research before making any decisions, taking into account their expertise in the market, the spread of their portfolio and attitude towards risk among other factors. They should also be sure to never trade with more money than they can afford to lose.