What is support and resistance?
Support and resistance (S&R) zones are very important technical indicators in technical analysis. Integral to any financial market, support and resistance levels essentially represent demand and supply – the order flow – which can rapidly shift.
Support and resistance indicators show some predetermined levels at which the market’s price is expected to stop and reverse. This widely followed technical analysis technique helps to quickly analyse the price chart and to determine the three key points:
The market’s direction
The time to enter the market
The points to exit the market
Highlights
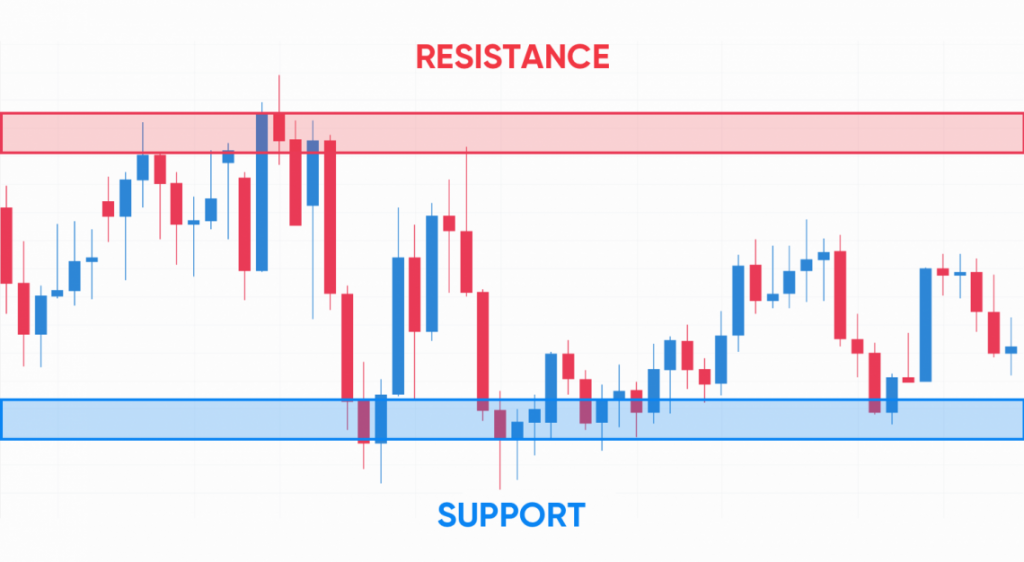
The support and resistance are specific price points on a chart expected to attract the maximum amount of either buying or selling.
Support is the level where demand in the market price is strong enough to stop the price from falling further.
Resistance is the opposite of support. At this level the supply is strong enough to stop the price from rising further.
Understanding support and resistance
Support is the level where the market price tends to find support as it falls. At that point the demand is strong enough to stop the price from falling further. This means that having reached this level, the market’s price is more likely to bounce off than break through and continue falling.
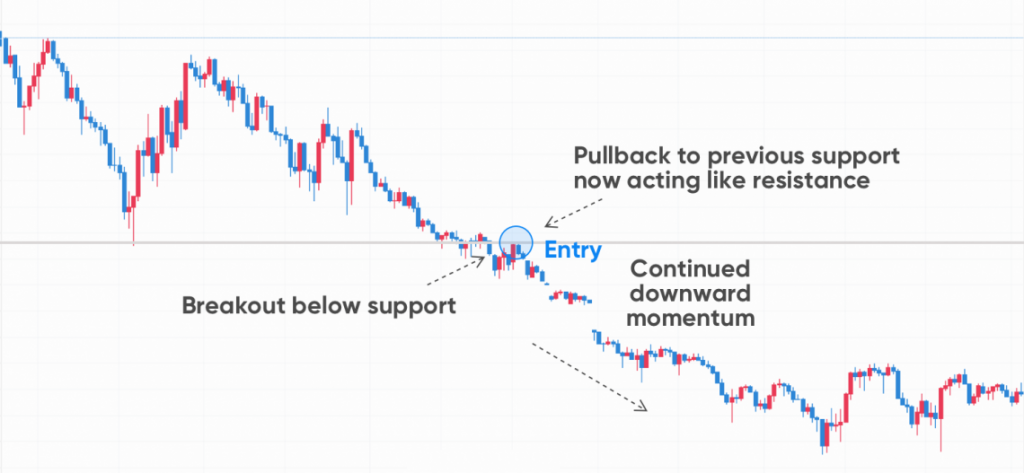
However, the price may still break through the support level and continue its downward movement until meeting another support level.
Resistance is the opposite of support. At this level the supply is strong enough to stop the price from rising further. It defines where the price will encounter resistance as it rises. As with the support level, the price may be likely to push away from this level rather than break through it. If it does happen, the price is likely to continue moving up until facing another level of resistance.
The concept of support and resistance consists of the support level, the ‘floor’ under trading prices, and the resistance level, the ‘ceiling’. In this case, a trading instrument is like a rubber ball bouncing in a room. It hits the floor and rebounds off the ceiling. The ball here, i.e., a trading instrument, experiences consolidation between support and resistance zones.
Fibonacci support and resistance
Fibonacci numbers, the work of 13th century Italian mathematician Leonardo Fibonacci, have been a popular ingredient in creating different technical indicators, including support and resistance indicators.
A series of Fibonacci numbers – 0, 1, 1, 2, 3, 5, 8, 13, 21, 34, 55, 89, 144 – are often used in order to calculate entry points while trading stocks, commodities and foreign exchange (forex) during market trends.
Fibonacci retracement numbers are used to indicate entry points and targets during the trending markets – they mark the reversal spots, where traders may catch entry points during retracements in the trend. If the market is uptrending, you use Fibonacci numbers from bottom to top. In a downtrending market, you use them from top to bottom.
Support and resistance zones
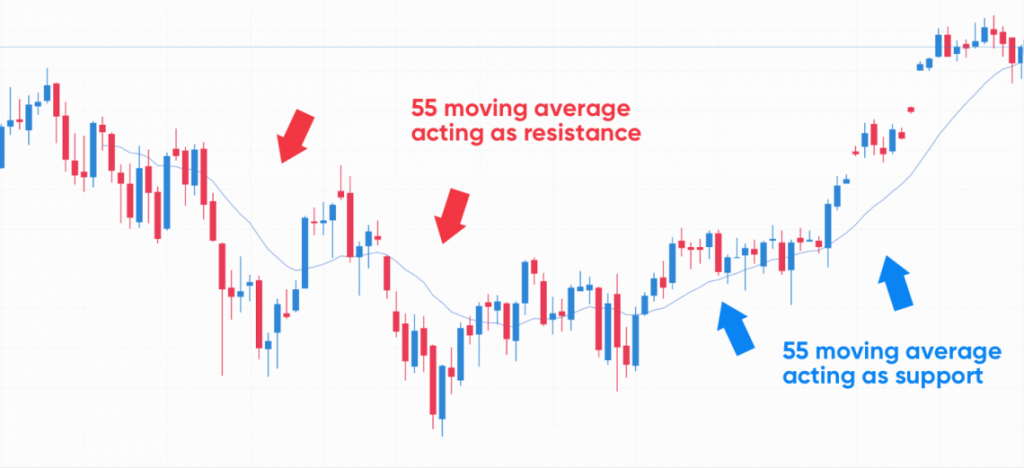
Support and resistance zones can be identified by analysing past price movements, chart patterns, or technical indicators such as moving averages (MAs).
Support zones are typically found near the previous low prices, while resistance zones are typically found near the previous high prices. Identifying these levels could potentially help determine entry and exit points for trades.
Examples of support and resistance zones include:
Moving averages. These are lines drawn on the chart that connect the average closing prices of a security over a set period of time.
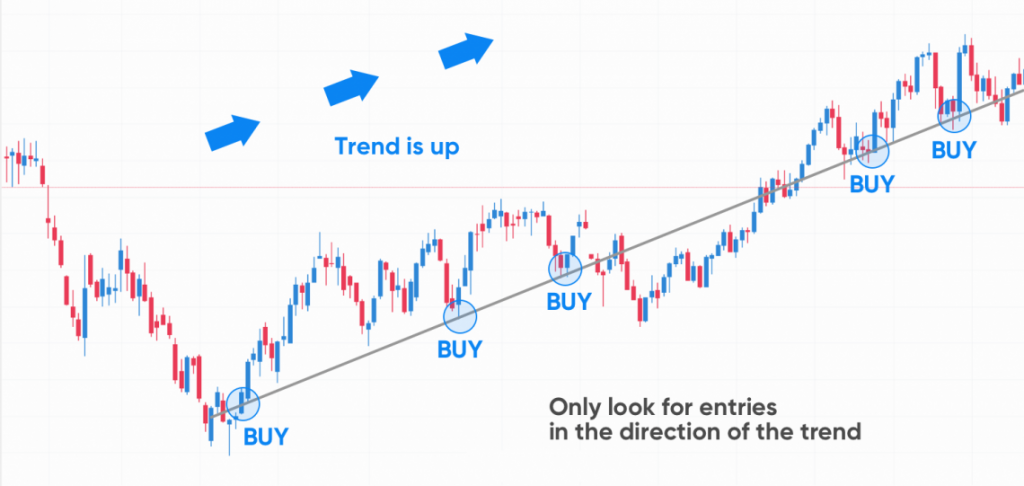
Trend lines. These lines connect the highs and lows of a security over a set period of time.
Volume spikes. These are areas of a chart where the trading volume of a security suddenly increases, indicating that the price may be due to change.
Round numbers. These are areas of a chart where the price of a security tends to find difficulty breaking through certain price points.
Fibonacci retracements. These are areas of a chart where the price of a security tends to find difficulty breaking through certain Fibonacci levels.
Using support and resistance levels in trading
How to use support and resistance in trading? Here are the top four support and resistance trading strategies:
Range trading occurs within the area between support and resistance lines as traders aim to buy at the support level and sell at the resistance level. Note that support and resistance do not always represent perfect lines. Sometimes there will be some noise around, rather than a perfect line. Traders have to identify a trading range – i.e., the areas of support and resistance.


