CFDs are complex instruments and come with a high risk of losing money rapidly due to leverage. 76% of retail investor accounts lose money when trading CFDs with this provider. You should consider whether you understand how CFDs work and whether you can afford to take the high risk of losing your money.
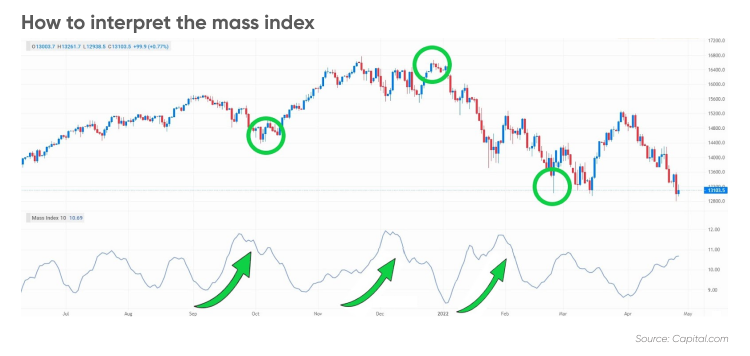
Mass index trading is possible with the mass index indicator. The intended use of this technical analysis tool is to predict price reversals. When the indicator line bursts upwards, it shows a potential change in trend but does not specify which direction that change in trend will be.
The mass index indicator is usually added at the bottom of a price chart as an underlying indicator, but can also be used on top of the price action as an overlaying indicator. It is not an oscillator because the values of the index go beyond the limits of -1 to 1. The typical range for the values of the indicator will be between +8 to +12.
To determine mass index indicator values, you can use the following mass index formula:
The first step is to set the time period for the indicator. The above example shows 25-periods but this can be sped up to 10-periods too.
The second step is to calculate the range between the high and low prices over each bar or candle within the set period. For example, if 25 days is set, then first the difference between the highest price and lowest price on day one would be calculated, then the difference between the high and the low on each next day, all the way to the 25th day.
The third step is to calculate the nine-day exponential moving average (EMA) of the range between the high and low prices over the set period.
The fourth step is to divide this figure by the nine-day exponential moving average of the moving average in the numerator.
The mass index was created by Donald Dorsey. He published an article about the mass index in the Technical Analysis of Stocks & Commodities magazine in June 1992. He used the mass index as his own variation on ‘range oscillation analysis’, which indicates how much the price range oscillates over time.
Dorsey claimed his mass index and range oscillation analysis “allows the technician to forecast market reversals that other indicators may miss”.
What is mass index doing to help with day trading? Traders use the indicator as a visual representation of what often happens to the range of price bars before a price reversal occurs.
The mass index indicator uses a mathematical formula to interpret how the range between the high and low of a market price changes over a given time period.
The range of a price bar is one of the simplest calculations of volatility. If the range is low, the price has not moved very much and the volatility is low.
Markets tend to repeat a pattern where the average daily range (ADR) moves from low to high and back to low again. This same concept can be seen in Bollinger bands, which oscillate from times when the bands are very close together and very far apart.
This pattern of when the daily range changes can be a useful indication that a market reversal is taking place. This is what is mass index
Donald Dorsey said that the most important signal in range oscillation analysis is the ‘reversal bulge’. This he defines as “a gradual but definite increase of the average daily range that indicates the market is near a turning point”.
It is hard to look at how the daily (or intraday) range is changing with the naked eye, which offers some justification for the use of a technical indicator like the mass index.
What is the mass index showing? As seen in the chart below, surges in the mass index can correlate with turning points in the price trend. When the indicator makes a big upward move and then turns lower again from the extreme reached, the indicator is modelling what is happening to the range of the price bars.
The price range is increasing quickly as a trend accelerates, but then decreases from an extreme level, signalling that volatility is slowing during the turning. The idea would be to enter a trade before the momentum increases in the new direction.
One useful aspect of the mass index is that it is designed to be market neutral such that the overall trend of the market does not affect the interpretation of a ‘reversal bulge’. A bulge could happen during a trading range or in a high momentum uptrend.
This is unlike some indicators, such as overbought/oversold oscillators, which are less useful during a trend, and trending indicators such as a moving average, which are less useful during a sideways range.
The indicator was originally designed for the daily time-frame chart, like most indicators that were designed before the dominance of online trading. However, it can just as easily be used on intraday charts like the one-hour time frame.
There are many trading strategies that can incorporate the mass index indicator, especially when paired with other technical indicators, particularly those that help determine the trend.
Below is one possible way to employ a mass index indicator strategy.
This trading system makes use of the ‘reversal bulge’, which is defined by the mass index (25) rising above a value of 27 and then falling back under a value of 26.5. The reversal bulge is a sign that the high-low range has reached an extreme, and then come out of the extreme position – indicating a change of trend.
The strategy also features an exponential moving average (EMA) set to nine periods. The EMA helps determine the trend, and thus determine whether to interpret the mass index ‘bulge’ as a reason to buy (go long) or sell (go short).
Step 1: Add the mass index indicator, set to 25 periods (instead of the default 10).
Step 2: Add a nine-period EMA to your chart.
Step 3: If the EMA points downwards, go long when there is a ‘reversal bulge’.
Step 4: If the EMA points upwards, go short when there is a ‘reversal bulge’.
Step 5: Add your preferred risk management tools, including a stop loss.
Variations of how to trade with the mass index can involve different indicator settings, such as a smaller value on the mass index (e.g. 10 instead of 25 periods) or differing indicator settings on the EMA (e.g. 5 instead of 9 periods).
Note that this is only one example of a potential strategy using the indicator. You shouldn’t use it as a substitute for your own research. Always conduct due diligence before trading, have a risk management strategy in place and never trade money you cannot afford to lose.
The first and clearest limitation of the mass index indicator is that it does not define the trend or the direction in which the market reversal will take place. It is for this reason that our mass index indicator strategy example above makes use of a moving average to determine the trend.
The other familiar limitation of this pattern is that it is a leading indicator. This means the signal of a market reversal happens some time before the reversal itself. Either this limitation is adapted for by adjusting stop losses to allow the reversal to take place, or other tools such as price-action candlestick signals, or lagging indicators such as a moving average, can be used to ‘confirm’ the reversal.
Contact us:call +33 187654090
Members of the Global Institute of Internal Auditors (IIA).
Member of the CypruS Institute of Int Aud Research & Training.
Members of the (CIIFA) and the Association’s Fin – tech Committee.
Instructors on Compliance, Regulation & Internal Audit at the Inst for Pro-Excellence (If0rPE).
This website G Assets LTD is operated authorized and regulated by Vanuatu Financial Services Commision , JLT ASSETS LTD
© 2023 G Assets LTD SV Investments Limited