CFDs are complex instruments and come with a high risk of losing money rapidly due to leverage. 76% of retail investor accounts lose money when trading CFDs with this provider. You should consider whether you understand how CFDs work and whether you can afford to take the high risk of losing your money.
The weighted moving average (WMA) gives greater weight to recent data. This is in contrast to the simple moving average, which assigns equal weight to all data points.
Therefore, the weighted moving average indicator measures how the price of a financial asset has moved over a certain period of time by using a weighted moving-average formula.
The weighted moving-average formula is calculated by assigning different weights to each of the data points in the series, with the most recent data point getting the highest weight.
This essentially converts the original prices to ‘weighted prices’. Then those new weighted prices are added up and divided by the number of periods to get the latest weighted moving-average value.
A popular type of Weighted Moving Average is the Exponential Moving Average (EMA). This indicator is available separately inside the trading platform.
It’s unknown who first began applying WMAs to trading financial markets. Yet the invention of the moving average dates back to the beginning of the 20th century.
Mathematician R. H. Hooker published a famous work on time series analysis in 1901 and referred to what were essentially WMAs as ‘instantaneous averages’.
The phrase ‘weighted moving average’ was first coined in 1909 by Yule, part creator of the Yule-Walker moving-average model, when describing Hooker’s process.
The weighted moving average offers an alternative to the simple moving average for traders looking to include the indicator as part of their trading strategy.
The weighted moving average method is a form of technical analysis that is used by traders to identify trends. Additionally, it can be used as a filter for price action and as an indicator of trend direction. It can also be used as a way to identify support and resistance levels on a chart.
The WMA can be used in conjunction with other indicators such as the Moving Average Convergence Divergence (MACD) and Relative Strength Index (RSI) to help traders make more informed trading decisions.
The weighted moving average smoothes out volatility in the raw price action, where volatile price moves over short periods can district traders from the bigger picture.
Instead of seeing big differences in highs and lows and opens and closes that are seen in candlesticks or bar charts, with a moving average there is only a single smoothed line.
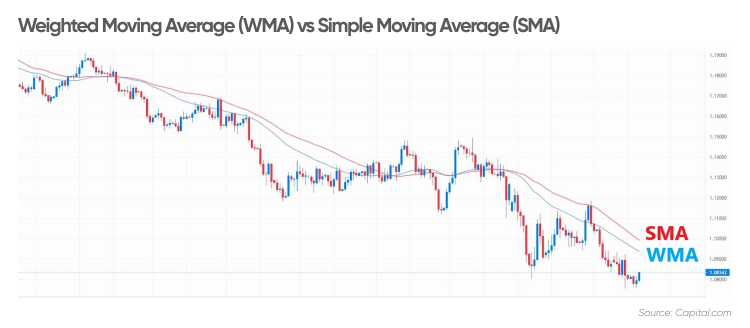
The WMA is a trend-following indicator that does not lag behind price as much as others because it puts greater emphasis on the latest prices. This means that when prices are moving, it will move in the same direction more quickly.
This is different from the SMA, which will track the price but because it equally accounts for all the prices that are being averaged, lags behind more than the WMA.
The indicator provides a simple way to identify trends, and it can be applied to any time frame without requiring complex calculations.
The weighted moving average can be used in a variety of financial and economic contexts, such as estimating future stock prices or how to trade forex.
There are multiple ways traders can interpret the WMA. For example, identifying trend direction and strength, or the likelihood of a trend reversal.
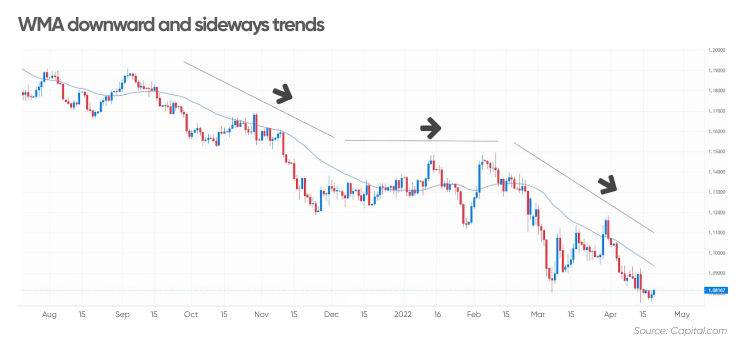
When the WMA line on the chart is pointing higher, it indicates an uptrend. Accordingly, when a WMA line is pointing downwards, it indicates a downtrend. If the WMA line is flat, it shows there is a sideways trend.
If the current price of an asset is above a rising weighted moving average, it shows the uptrend is currently stronger than average. Likewise, if the current price is below a rising WMA it shows the strength of the price is weaker than average.
The same interpretation can be made in downtrends, though they tend to be more volatile, therefore a higher period setting on the WMA indicator is likely to capture the price moves better. For example, traders can use a 50-period WMA instead of a 20-period WMA for a downtrend.
The first sign that a trend may be reversing is when the price crosses over the weighted moving average.
This is then confirmed when the price remains above the WMA, while the WMA itself then begins to slope in the new direction, for example from up to down, or from down to sideways.
The weighted moving averages can be used to help traders decide when to buy or sell stocks based on how they react to different market conditions. It can be used to identify trend reversals and support and resistance levels.
Additionally two or more WMAs of different lengths can be used together to form a more complete weighted moving average method of forecasting.
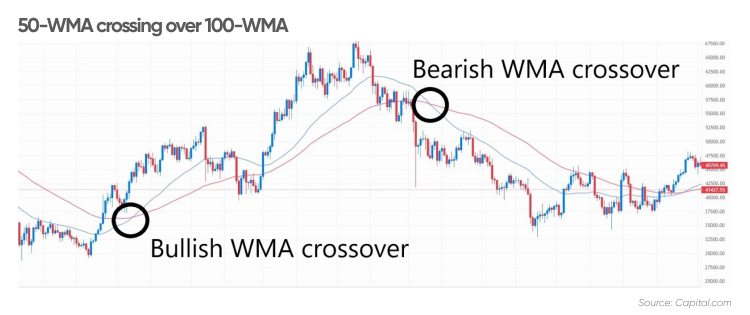
The following chart shows the 50-WMA crossing over the 100-WMA.
Traders can look for when the short-term WMA crosses over the long-term WMA as a signal that the trend has changed. The crossover itself tends to happen after the trend has changed, offering a late confirmation of what has happened with the price action.
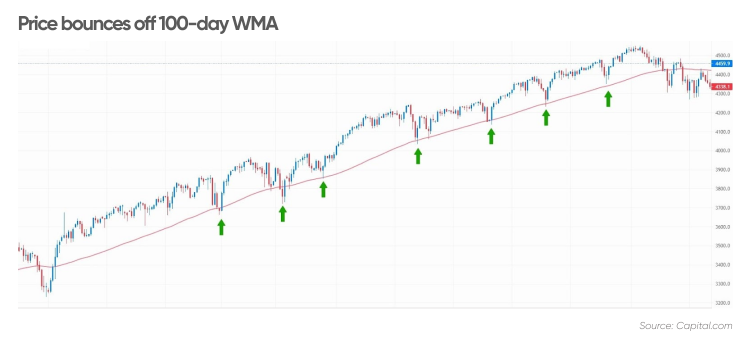
WMAs don’t typically work as reliably as the weighted moving average forecasting example below, where a months-long uptrend was supported by the 100-day WMA, seeing the price bounce off it several times.
Traders can use this weighted moving average method to take buy signals on the rising WMA line or sell signals near a falling WMA line. One option is to set a limit order at the WMA or wait for the price to touch the WMA and close back on the right side of it as extra confirmation.
Although WMA can be useful in trading, it also has its limitations that traders should be aware of when developing their strategy.
When a market is trending, the weighted moving average can identify this fact, allowing traders to follow the trend, only placing buy orders in an uptrend or sell orders in a downtrend.
However, in a range bound or sideways market, the WMA will begin to show a trend but then change direction again as the sideways market hits its floor or ceiling.
A one-off high volatility period can be enough to take the price past the WMA, whereas it might not have been enough with a SMA.
Although the WMA tends to react quicker to changes in price than the SMA, it is nonetheless a lagging indicator. The WMA can never be used to try to pick a market top or bottom because the change in trend will take time to materialise in the average prices.
Contact us:call +33 187654090
Members of the Global Institute of Internal Auditors (IIA).
Member of the CypruS Institute of Int Aud Research & Training.
Members of the (CIIFA) and the Association’s Fin – tech Committee.
Instructors on Compliance, Regulation & Internal Audit at the Inst for Pro-Excellence (If0rPE).
This website G Assets LTD is operated authorized and regulated by Vanuatu Financial Services Commision , JLT ASSETS LTD
© 2023 G Assets LTD SV Investments Limited