CFDs are complex instruments and come with a high risk of losing money rapidly due to leverage. 76% of retail investor accounts lose money when trading CFDs with this provider. You should consider whether you understand how CFDs work and whether you can afford to take the high risk of losing your money.
Unveil the EMA trading world, including trend identification, trading strategies, and risk management insights to enhance your trading experience.
The Exponential Moving Average (EMA) trading strategy is a trading approach that involves using EMA, a technical analysis tool that can help identify market trends and potential entry and exit points.
The EMA trading strategy employs EMA, a type of moving average that assigns greater weight to recent price data compared to the Simple Moving Average (SMA), which makes it more responsive to current market conditions.
The EMA crossover strategy involves monitoring two or more EMAs with different time frames to generate potential trading signals.
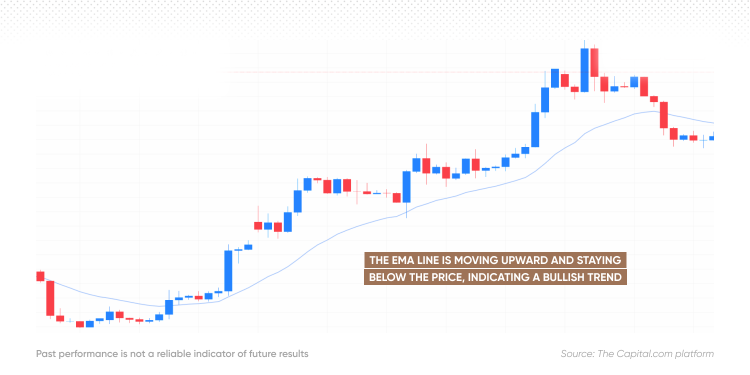
To determine the potential trend using EMA, traders observe the direction of the EMA line and its position relative to the price chart.
Combining EMA with other technical indicators, such as the Relative Strength Index (RSI) or the Moving Average Convergence Divergence (MACD), may help the performance of trend-following strategies.
Effective risk management, along with maintaining discipline, patience, and emotional control, can prove vital for any trading strategy, including EMA-based trading.
The Exponential Moving Average (EMA) is a type of moving average that assigns greater weight to recent price data, making it more responsive to current market conditions.
Although the EMA indicator is automated on most platforms, understanding the mechanism behind it may help traders in using it more efficiently. To calculate the EMA, traders first determine the initial SMA for a specified period, which is then used as the basis for subsequent calculations. The EMA formula takes the previous day’s EMA, multiplies it by a smoothing factor, and adds the result to the current day’s price data.
Advantages of EMA include its responsiveness to recent price movements and its ability to filter out market noise. However, the primary disadvantage of EMA is that it may generate false signals due to its sensitivity to short-term price volatility.
The Exponential Moving Average formula is:
Where:
EMA_today is the EMA value for today
Price_today is the asset’s closing price for today
N is the chosen period (number of days) for the EMA
EMA_yesterday is the EMA value for the previous day
If you don’t have the previous day’s EMA value, you can start by calculating the SMA for an initial period as a base value for the EMA calculation.
Setting up the EMA indicator involves determining the time period for which the average will be calculated, as well as selecting the appropriate weight or smoothing factor. Adjusting these settings allows traders to tailor the EMA to their preferred trading style.
For instance, day traders may opt for a smaller period to closely track recent price changes, while position traders could use a longer period to capture the overall trend and filter out short-term noise.
The versatility of EMA offers numerous creative ways of using in trading, depending on a trader’s preference. Below are some of the popular ways of how to use the indicator.
To determine the trend, traders may observe the direction of the EMA line and its position relatively to the price chart.
If the EMA is sloping upward and is below the price, it generally indicates a bullish momentum. When EMA is above the price and upward-sloping it generally signifies bullish momentum, but with increased resistance.
Conversely, if the EMA is sloping downward and is above the price, it may suggest a bearish trend. If EMA is downward sloping and below the price, it suggests that a downtrend may face some resistance.
It is essential to analyse the direction of the EMA in conjunction with the price position to accurately gauge the trend.
The EMA can also act as dynamic support and resistance levels, providing traders with valuable information on potential price reversals or continuations. By monitoring the relationship between the EMA line and the price, traders can gauge the strength of the prevailing trend. For example, when EMA crosses below the price in a downtrend, it may signal that a bullish reversal is likely. Conversely, if EMA shoots above the price in an uptrend, it may indicate that a bearish reversal is probable.
An EMA crossover strategy involves monitoring two or more EMAs with different time frames to identify trading signals. When a shorter-period EMA crosses above a longer-period EMA, it generates a bullish signal, indicating a potential uptrend. Conversely, when a shorter-period EMA crosses below a longer-period EMA, it generates a bearish signal, suggesting a potential downtrend.
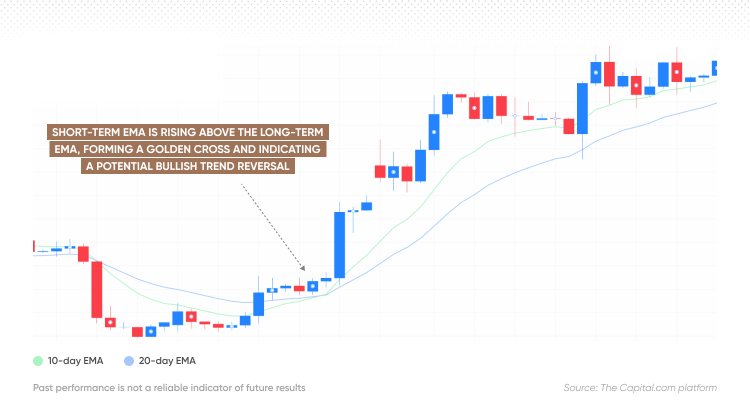
There are two primary types of EMA crossovers: the golden cross and the death cross. A golden cross occurs when a short-term EMA crosses above a long-term EMA, indicating a potential upward price movement. A death cross transpires when a short-term EMA crosses below a long-term EMA, signalling a potential downward price movement.
To use this EMA trading strategy for trading, traders may pay close attention to the intersection points of the EMAs and the price action that follows, taking into account other technical indicators and market context to ensure reliable signals.
Short-term EMA is rising above the long-term EMA, forming a golden cross and indicating a potential bullish trend reversal.
EMA + Moving Average Strategy: In this EMA strategy, traders use a combination of a short-term EMA and a longer-term SMAs to generate buy or sell signals based on their respective crossovers.
EMA + RSI Strategy: By combining the EMA with the RSI, traders can enhance the effectiveness of their trend-following approach. The RSI helps identify overbought or oversold conditions, which can serve as confirmation for EMA-based trading signals.
EMA + MACD Strategy: The MACD indicator measures the relationship between two EMAs and can be employed alongside the EMA to confirm trend direction and strength.
Trading psychology plays a crucial role in the success of any trading approach, including EMA trading strategies. By maintaining discipline, patience, and emotional control, traders can avoid common pitfalls such as impulsive decision-making and overtrading.
Risk management is equally important in trading. Some effective risk management techniques include:
Setting stop-loss orders: Stop-losses involve specifying a predetermined price level at which a losing trade will be closed automatically to limit potential losses. Note that only paid-for guaranteed stop losses protect from slippage.
Setting take-profit orders: Take-profit orders define a target price level where a trade will be closed once the desired price is reached.
Position sizing: In the context of trading, position sizing focuses on determining the suitable number of contracts or shares to be traded in a single position, based on the trader’s risk tolerance, account size, and the specific characteristics of the asset or instrument being traded.
Diversifying trading instruments: Diversification strategy entails trading a variety of assets or instruments to spread risk and reduce the impact of adverse market movements on the overall portfolio.
Risk-reward ratio: The concept of the risk-reward ratio refers to the comparison between the potential profit and the potential loss of a trade, helping traders to evaluate the viability of a trade before entering it.
Testing strategy on a demo account: Before applying an EMA-based trading strategy in a live market, traders can practise and refine their approach using a demo account. This risk-free environment allows for the evaluation of different settings and techniques, and can help traders to fine-tune their strategy before committing real money.
In conclusion, the EMA indicator is a trading tool that can help traders identify market trends and potential entry and exit points. As a more responsive alternative to SMA, EMA’s calculation assigns greater weight to recent price data, making it particularly effective in navigating current market conditions.
Meanwhile, the EMA-based strategies, such as observing EMA’s direction, or two EMAs as they crossover, and combining EMAs with other indicators like RSI and MACD, could help traders in their decision-making processes.
It’s important to be aware of trading psychology and use risk management techniques. Always conduct your own due diligence before trading, and never trade more money than you can afford to lose.
Contact us:call +33 187654090
Members of the Global Institute of Internal Auditors (IIA).
Member of the CypruS Institute of Int Aud Research & Training.
Members of the (CIIFA) and the Association’s Fin – tech Committee.
Instructors on Compliance, Regulation & Internal Audit at the Inst for Pro-Excellence (If0rPE).
This website G Assets LTD is operated authorized and regulated by Vanuatu Financial Services Commision , JLT ASSETS LTD
© 2023 G Assets LTD SV Investments Limited