USA flag on the background of stock charts. Financial system in USA. Source: getty images
The pullback in the US stock market has started to grab people’s attention as concerns about the economy’s future grow. Last week, the Federal Reserve (Fed) decided to leave its base rate unchanged at 5.5% – but the messaging around the decision clearly hints at a high chance that another rate hike may occur in the coming months if the data deems so.
Markets are currently pricing in an 81% chance that the Fed leaves rates unchanged at their next meeting on November 1st, but we haven’t seen any significant data since the last meeting, so this is likely to change over the coming weeks. Right now, it’s very much like shooting in the dark.
The top-line economic data continues to show resilience, which has been one of the main drivers behind the outperformance of the stock market. Investors and traders who have been focusing on the employment and growth data have likely felt like the US economy has successfully navigated the worst of the post-pandemic recovery period and the effects of the Russian invasion of Ukraine. In all fairness, it is a very valid view to have. Add to that the fact that inflation has dropped significantly in recent months but hasn’t plummeted, and you get the view of a strong and resilient economy.
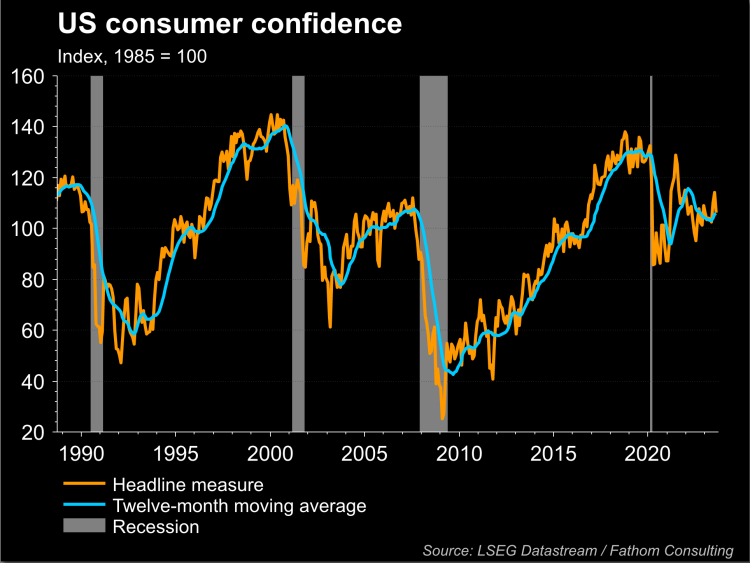
Source: refinitiv
But stock valuations remain excessively high, and at some point, the ongoing tightening in monetary conditions must matter.
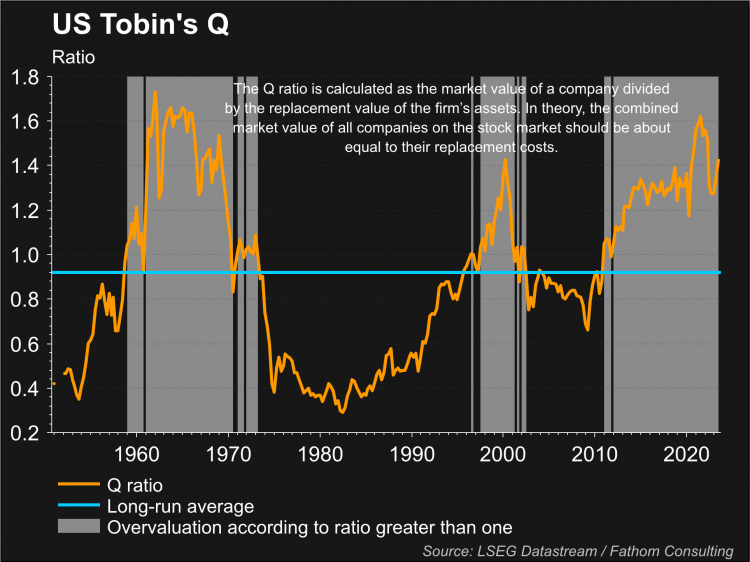
Source: refinitiv
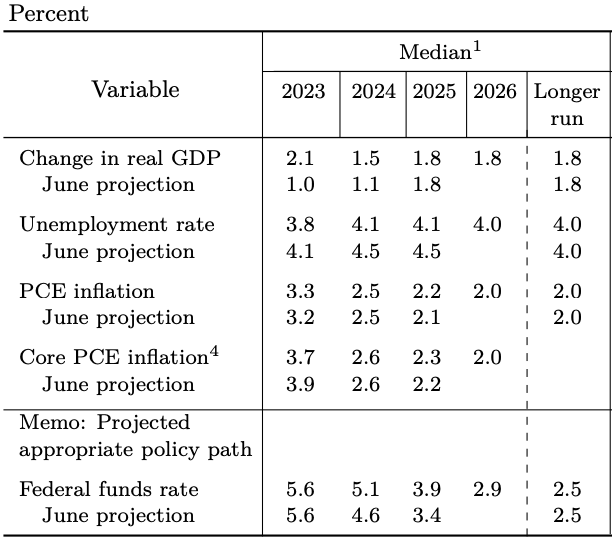
The updated dot-plot chart showed the Fed has ruled out 50bps of cuts in 2024, cutting it down from 4 cuts to just 2. On the surface, this is good news, as it means the Fed is more optimistic about the future of the economy. But as we know, the dot plot is never really that accurate at predicting what will actually happen: it’s used more as a tool to drive influence. It’s important to ask what could happen to consumption and spending in the next 12 months when rates are expected to be kept at the terminal level – which has been reached after 18 months of conscious efforts to slow consumption and an overheating economy.
Updated projections from the Federal Reserve September meeting
Source: federalreserve.gov
Big vs. small cap stocks in 2023: two different tales?
One of the big stories driving market valuations this year has been the AI revolution, which has once again put the big technology companies on top. Not surprisingly, the Nasdaq 100 has been the clear winner this year, followed closely by the S&P 500. But even the heavy hitters have started to turn. Microsoft is down 14% from this year’s high. Apple -12%, and META -9.5%. The combined performance of the big tech stocks – as measured by the FAANG index – shows a drop of 8% from the highs seen earlier this year.
This has started to draw big attention to the major indices, with the Nasdaq 100 having pulled back 8% from its highs earlier in the summer. But what about other parts of the economy, those that aren’t measured by the major indices?
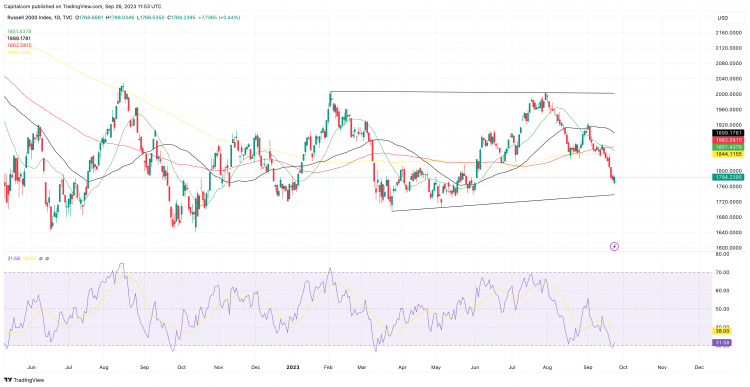
If we look at the Russell 2000 – which is a good benchmark of the overall market as it measures those companies with smaller market caps – we can see that despite a good start to the year and a strong rebound in the summer, the index is pretty much flat on the year. The pullback from the summer highs currently stands at 11.5%, but the fact that it has undone most of the gains seen earlier this year evidences how lagged the smaller cap stocks have been to the big hitters.
Forecasts are showing cautious optimism for the US stock market in Q4. The chart below – compiled by Blackrock Fundamental Equities – reveals that on average, the fourth quarter has seen an uptick of 4% in the S&P 500 index. And in those years where the first three quarters have seen a performance similar to (or above) the one we’ve seen so far this year, the general tendency is to see a positive performance in the last quarter of the year.
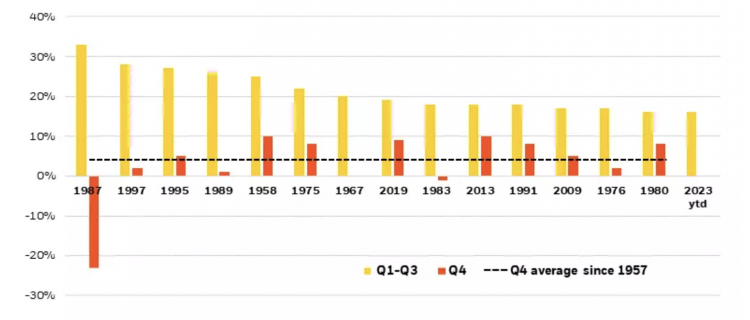
Source: Blackrock Fundamental Equities
Of course, past performance cannot guarantee future results, but it’s understandable why traders seem to be showing no clear signs of concern just yet. In fact, looking at gold– the traditional safe haven against recessions– its performance in the last 4 months suggests there has been no material shift in concerns about the future of the US economy.
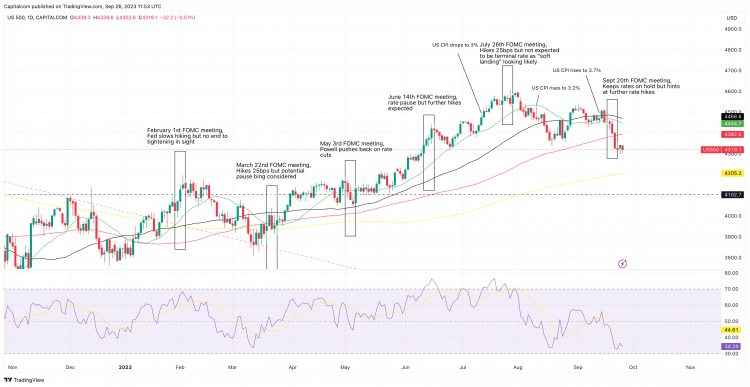
The recent pullback in stocks has seen the S&P 500, the Nasdaq 100, and the Russell 2000 all cross below their 100-day simple moving average (SMA). For the first two, this is the first time since the first few months of 2023. For the Russell, it is a more common occurrence, but the index is now also below its 200-day SMA, which has acted as tough resistance in the past. The common denominator is that all three of these indices have seen their RSI move from overbought in mid-July, to now skimming just above oversold, suggesting the short-term momentum has taken a dive.
That said, the patterns suggest some areas of support have been reached, with the last few sessions showing clear signs of new buyers taking interest. Both the S&P and the Nasdaq are currently consolidating around the lows seen during the pullback in August, and so far, sellers are struggling to get the upper hand to decisively move lower from here.
For the Russell 2000, for most of 2023, the price has been constrained within a mildly ascending pattern. The July highs topped at the upper bound of the pattern – resistance at the 2,000 mark – and has made its way towards the lower bound (a slightly ascending support trend line currently at 1,740). This pattern suggests an upside reversal is within sight, if not already underway. A break below this level would signal the start of a greater pullback, possibly entering into a bear market zone.
Both the charts and the data suggest the possible continuance of the current bullish trend. But with breadth in markets having been so reduced, with a small handful of big names having driven most of the rally, one starts to wonder how long can this go on before it becomes unsustainable.
Russell 2000 daily chart
Nasdaq 100 daily chart

S&P 500 daily chart
